![]() Figure 5 of
Hackam, Mol Vis 2003;
9:262-276.
Figure 5 of
Hackam, Mol Vis 2003;
9:262-276.
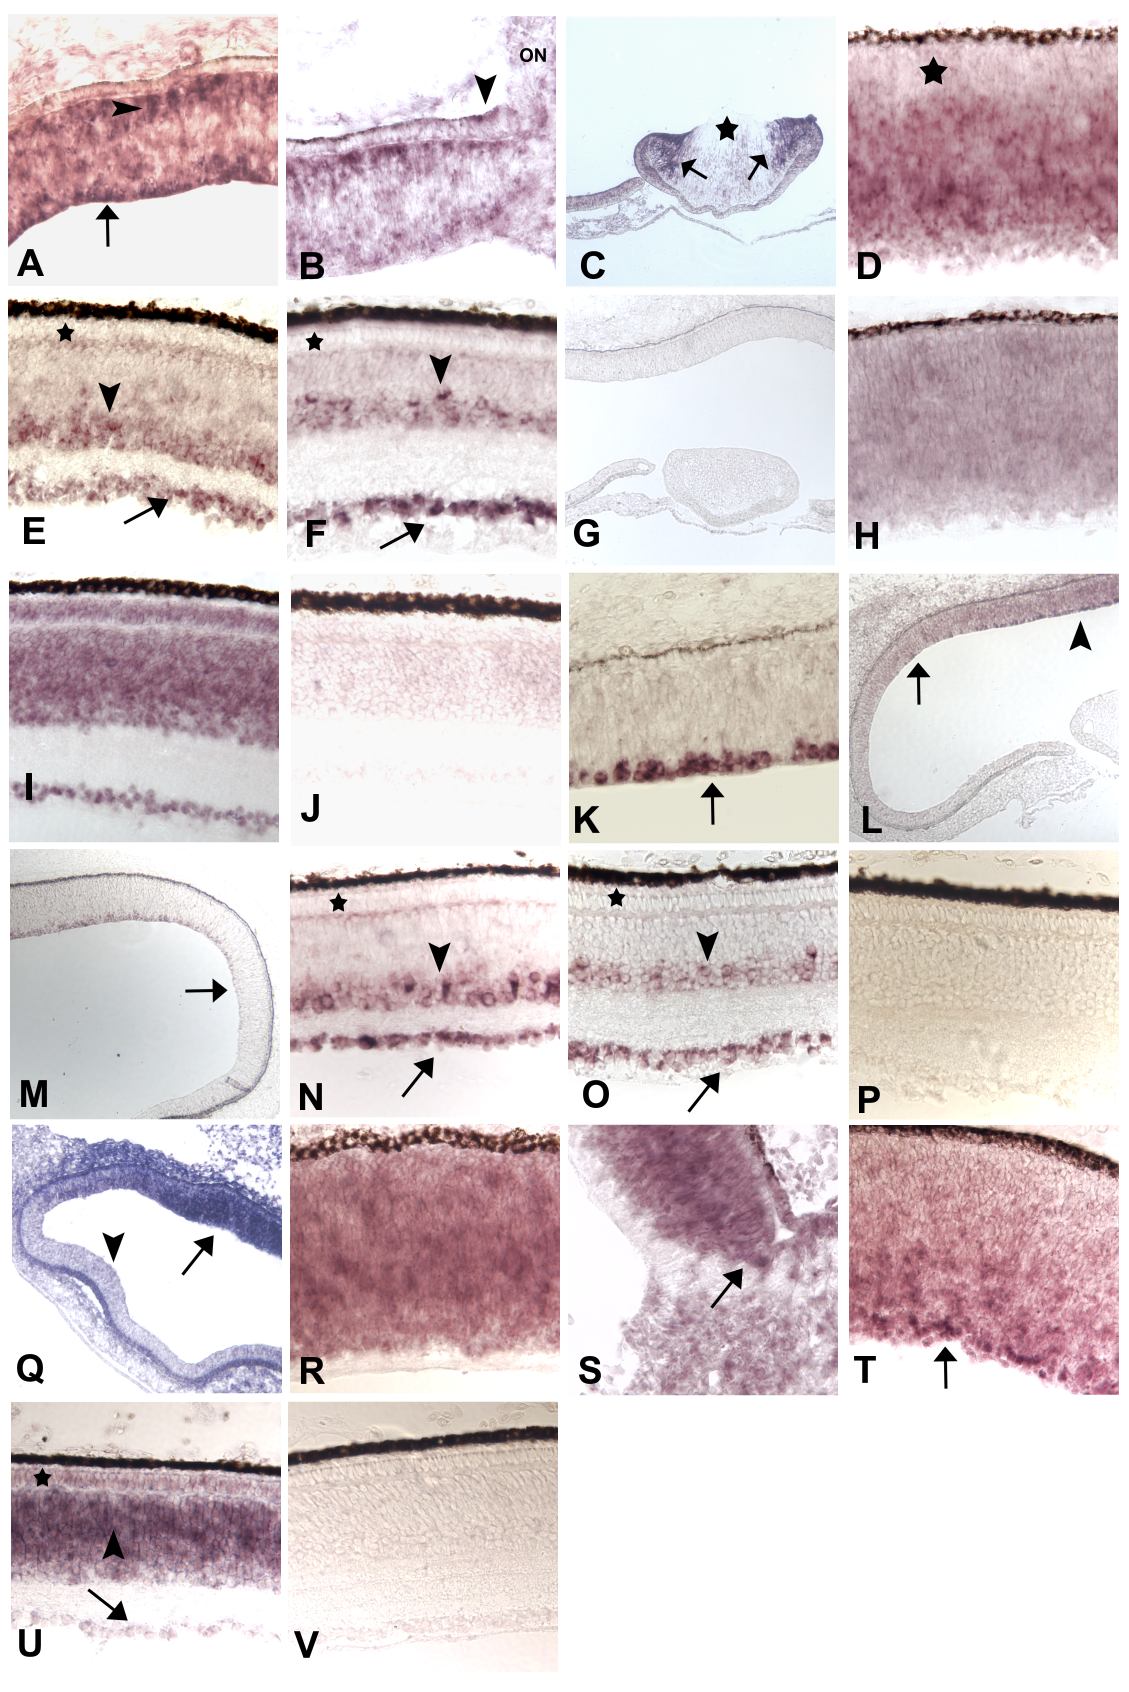
Figure 5. Developmentally-regulated expression of chick genes
A-G: CRG110, macrophage migration inhibitory factor, MIF. A, B, and C: ED 5. Widespread expression in the retinal neuroepithelium, particularly near the vitreal surface (A, arrow) and adjacent to the RPE (A, arrowhead). Restricted signals in the region adjacent to the RPE near the optic nerve (ON) in B; signals also detected in the RPE (arrowhead). The anterior epithelium of the embryonic lens appeared negative (C, *), but strong signals are seen at the lens equator (C, arrows). D: ED 8. The putative photoreceptor layer is negative (*), but expression is widespread, although a bit irregular in the rest of the retinal neural epithelium. E (ED 12), F (ED 18). Expression becomes restricted to the GCL (arrows) and the amacrine cell layer (arrowheads). The photoreceptor layer is negative (*). H-J: CRG100, homologous to defender against death, DAD1. This gene showed widespread expression throughout development, as illustrated for ED 5 (H) and ED 18 (I). K-P: CRG196, homologous to stathmin-like 2. K and L: ED 5. In fairly thin sections (K), expression appears completely restricted to cells which, based on their size and position, can be identified as recently generated retinal ganglion cells (arrow). This pattern is only seen in the fundal region (L, arrow); in this slightly thicker section, some signal can be observed in other regions of the fundal neuroepithelium (arrowhead). M: ED 8. Expression is restricted to retinal ganglion cells, but the domain of expression has spread peripherally (arrow). N (ED 15) and O (ED 18). Ganglion cell expression (arrows) is now accompanied by significant (but not uniform) expression in the amacrine cell layer (arrowheads). Photoreceptors are negative (*). Q-V: CRG233, chicken HT7 antigen. Q: ED 5. Expression is more intense at the fundus of the eye (arrow) and is practically undetectable at the periphery (arrowhead). R, S, and T: ED 8. Intense expression at the retinal fundus (R) with a clear demarcation with the ON (S, arrow). At the periphery (T) the future INL appears much lighter than the fundus (compare T and R), but heavily labeled ganglion cells can be seen (T, arrow). U: ED 15. INL is strongly positive, particularly on its outer half (arrowhead); photoreceptors show some signal (*), but ganglion cells are negative (arrow). G, J, P, and V are sense control images for CRG110, 100, 196 and 233.