![]() Figure 3 of
Zalewska, Mol Vis 2003;
9:257-261.
Figure 3 of
Zalewska, Mol Vis 2003;
9:257-261.
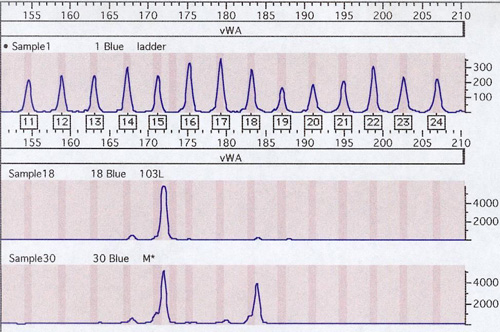
Figure 3. Genotyper pattern of LOH at locus VWA
The upper panel shows an allelic ladder (sample 1). The lower panel is reference blood DNA showing a profile of alleles 15 and 18 (sample 30). The middle panel is iris DNA showing loss of heterozygosity at allele 18 (sample 18).