![]() Figure 1 of
Wordinger, Mol Vis 2003;
9:249-256.
Figure 1 of
Wordinger, Mol Vis 2003;
9:249-256.
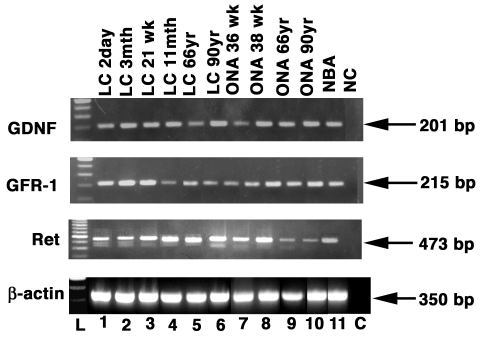
Figure 1. GDNF and GDNF receptor complex expression in human LC cells and ONH astrocytes
Ethidium bromide-stained agarose gel of GDNF and GDNF PCR products from cDNA samples generated from RT-PCR analysis of GDNF and GDNF receptor complex expression in human LC cells (lanes 1-6) ONH astrocytes (lanes 7-10), normal brain astrocytes (lane 11). NC = PCR negative control lane. L= base pair markers β-actin was used as a positive RT-PCR internal control.