![]() Figure 6 of
Suryanarayana, Mol Vis 2003;
9:223-230.
Figure 6 of
Suryanarayana, Mol Vis 2003;
9:223-230.
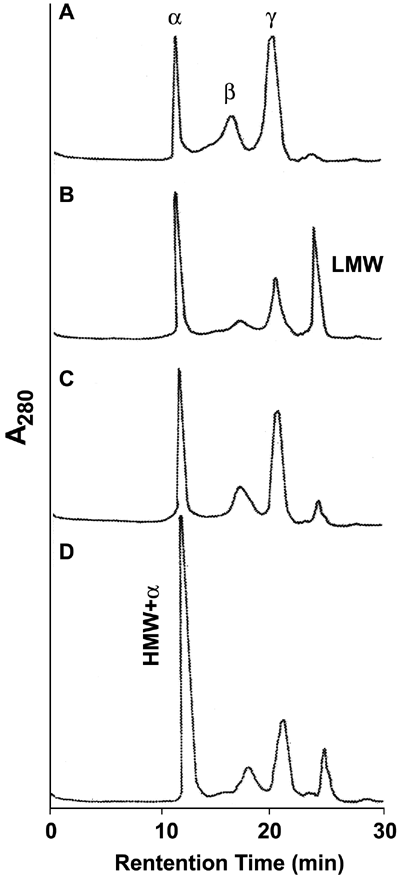
Figure 6. Distribution profile of crystallins
Distribution profile of crystallins in soluble fraction of group A (A), group B (B), group C (C) and group D (D) rats. Soluble protein (20 μl, 1 mg/ml in equilibration buffer) was loaded on TSK-G 2000 SW gel filtration columns and protein peaks were detected at 280 nm with a flow rate of 1 ml/min. Peaks representing α-, β-, and γ-crystallins, low molecular weight (LMW) and high molecular weight (HMW) fractions are indicated at their respective positions.
