![]() Figure 3 of
Dentchev, Mol Vis 2003;
9:184-190.
Figure 3 of
Dentchev, Mol Vis 2003;
9:184-190.
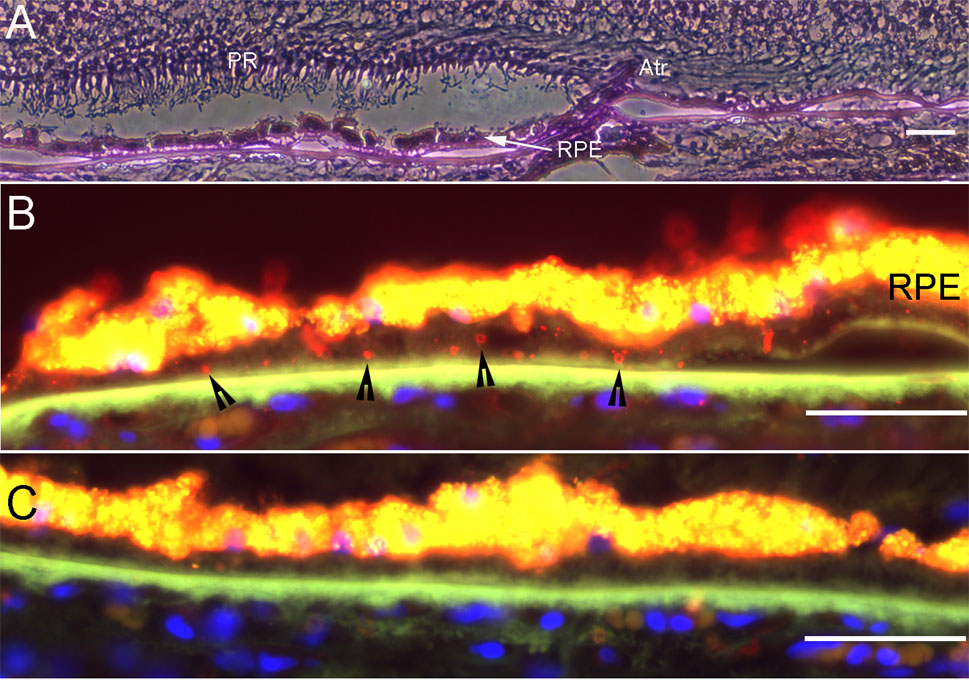
Figure 3. Aβ in drusen in GA retina 99-30 near atrophic area
Fluorescent photomicrographs showing Aβ in drusen in GA retina 99-30. A: PAS-hematoxylin-stained low power view of edge of atrophy (atr). B: Anti-Aβ antibody 4G8 detects vesicles (arrowheads) in sub-RPE deposit. C: Pre-adsorption with Aβ peptide eliminates label. Scale bar represents 50 μm.