![]() Figure 3 of
Burt, Mol Vis 2003;
9:164-170.
Figure 3 of
Burt, Mol Vis 2003;
9:164-170.
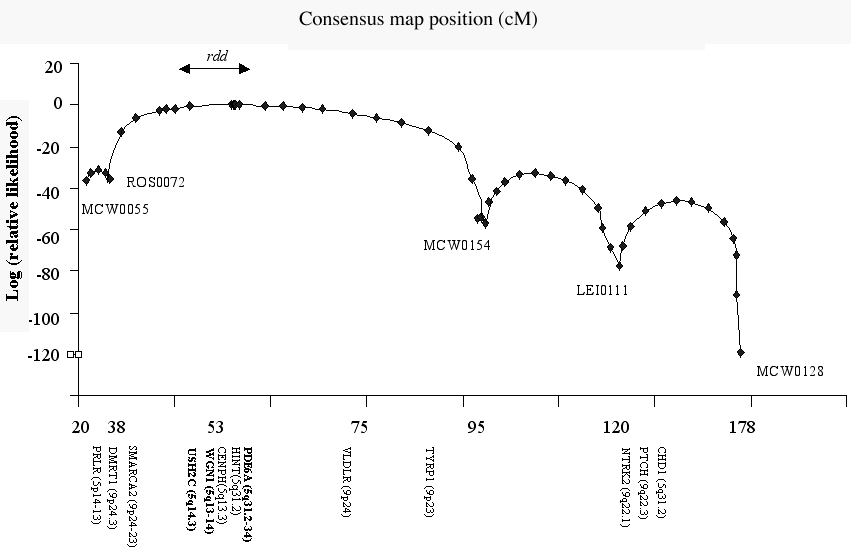
Figure 3. Mulitpoint genetic mapping of the rdd locus on the chicken Z chromosome
Graph of the relative probability for the location of the rdd locus in relation to Z chromosome markers, calculated using the Crimap program. Genes shown in normal font below the x-axis are the chicken homologues of known human genes placed on the comparative map of the chicken versus human genomes. Genes and loci shown in bold represent probable placements based on proximity to genes placed on the comparative map.
