![]() Figure 3 of
Chen, Mol Vis 2003;
9:151-158.
Figure 3 of
Chen, Mol Vis 2003;
9:151-158.
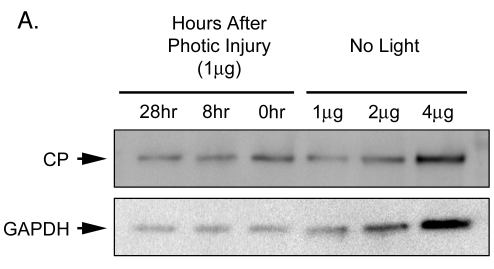
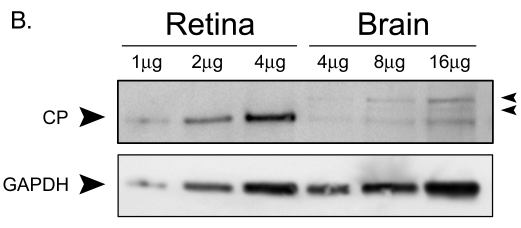
Figure 3. Ceruloplasmin protein levels
A: Western analysis showing increased Cp protein in retinas following photic injury. The top half of the filter was exposed to anti-Cp and the bottom half to anti-GAPDH antibody. The band intensities at 0, 8, and 28 h after the termination of 7 h light exposure were compared to serial dilutions of total retinal protein as indicated from mice not exposed to light. B: Western analysis demonstrating higher levels of Cp protein in retina than in brain. Serial dilutions as indicated of total protein from retina and brain were compared. The top half of the filter was exposed to anti-Cp and the bottom half to anti-GAPDH antibody. Arrowheads on the right indicate two bands detected in the brain but not the retinal samples.