![]() Figure 2 of
Chen, Mol Vis 2003;
9:151-158.
Figure 2 of
Chen, Mol Vis 2003;
9:151-158.
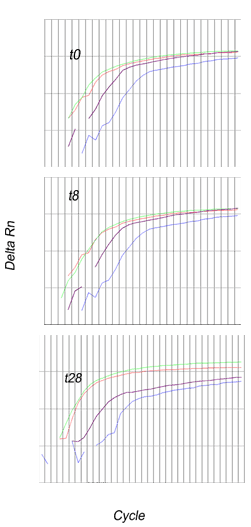
Figure 2. Ceruloplasmin mRNA levels
Ceruloplasmin mRNA levels increases eight-folds following photic injury. Quantitaitve PCR for ceruloplasmin and GAPDH was performed with retinal cDNA from the no light control, the light exposed t0 (top panel), t8 (middle panel), and t28 (bottom panel) experimental groups. Fluorescence emission is measured continuously during the PCR amplification and delta Rn (increase in fluorescence emission substracted from the background fluorescence signal) is plotted against cycle number. Each space between each horizontal lines represents a 2.8-fold difference in fluorescence intensity, while each vertical line indicates one PCR cycle. Red lines: GAPDH from no light retinas. Green lines: GAPDH from photic injury retinas. Blue lines: ceruloplasmin from no light retinas. Purple lines: Ceruloplasmin from light damaged retinas.