![]() Figure 2 of
Mawrin, Mol Vis 2003;
9:10-13.
Figure 2 of
Mawrin, Mol Vis 2003;
9:10-13.
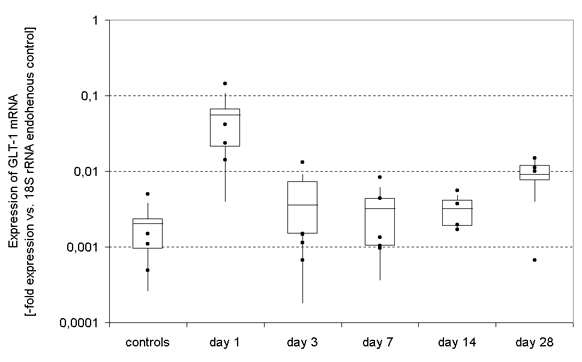
Figure 2. GLT-1 mRNA expression in rat retina after ONC
Quantitative analysis of GLT-1 mRNA expression in rat retina following partial optic nerve crush (ONC) and in sham-operated controls. Expression of GLT-1 mRNA was analyzed by quantitative real-time PCR using the TaqMan® system. At day 1 post-ONC, GLT-1 mRNA was increased significantly compared with controls (p<0.05). GLT-1 mRNA levels showed a marked decrease at days 3, 7, and 14 post-ONC. GLT-1 mRNA levels increased after 28 days post-ONC, but remained below control levels.
