![]() Figure 6 of
Al-Ghoul, Mol Vis 2003;
9:119-128.
Figure 6 of
Al-Ghoul, Mol Vis 2003;
9:119-128.
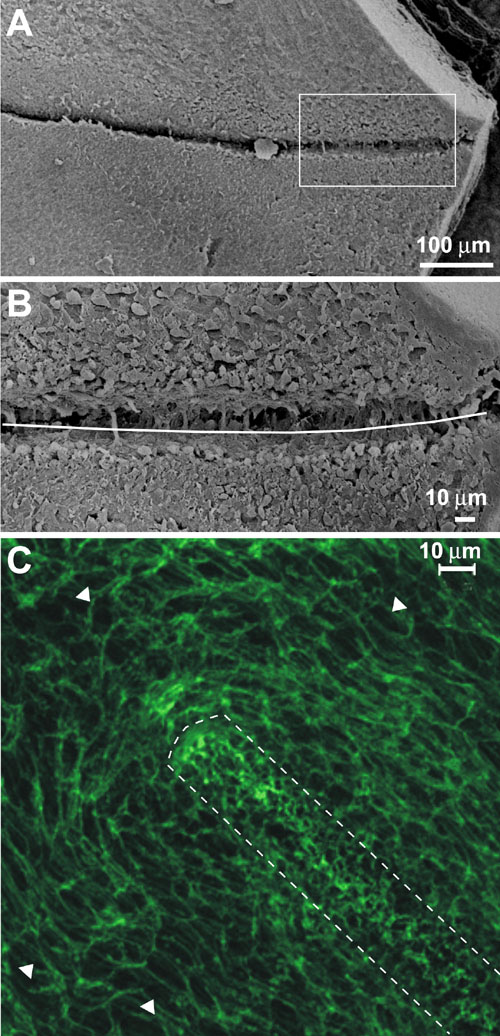
Figure 6. The sutural region
A and B: SEM micrographs of intact fiber ends. B is a higher magnification view of the inset in A. The white line is superimposed over the suture branch in B. C: LSCM micrograph of F-actin fluorescence. The sutural region is delineated by the white dotted line. Directly adjacent to suture branches, fiber ends appeared to become rounded, and were reduced in size compared to ends in the peri-sutural region (see Table 2). The linear arrangement of ends in the peri-sutural region (C, arrowheads) was not present directly adjacent to and at suture branches.