![]() Figure 4 of
Al-Ghoul, Mol Vis 2003;
9:119-128.
Figure 4 of
Al-Ghoul, Mol Vis 2003;
9:119-128.
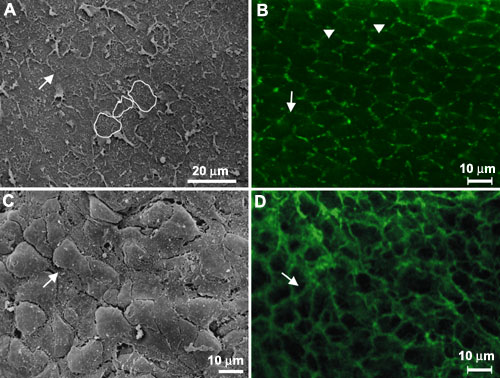
Figure 4. The lateral-posterior region
SEM (A) and LSCM (B) micrographs taken from whole-mount specimens in the initial portion (approximately the first 100 μm posterior to the equatorial region) of the lateral posterior region. In this area, fiber ends were variable in size and shape, and were arranged in short irregular rows (arrowheads) oriented toward the posterior pole. SEM micrograph of intact fiber ends (C) and LSCM micrograph of F-actin fluorescence (D) in the distal portion of the lateral-posterior region (further posterior). Fiber ends in this area displayed marked variation in size and shape, and appeared to be randomly arranged. Arrows indicate the direction of fiber end migration in A-D.