![]() Figure 7 of
Srivastava, Mol Vis 2003;
9:110-118.
Figure 7 of
Srivastava, Mol Vis 2003;
9:110-118.
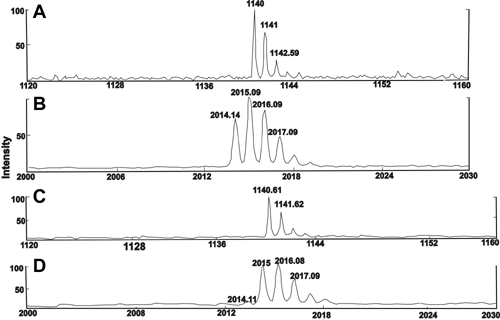
Figure 7. Isotopic distribution in the MALDI spectrum of tryptic fragments of TCA soluble polypeptides
Isotopic distribution in the MALDI spectrum of tryptic fragments of TCA soluble polypeptides isolated from WS proteins of normal lenses. A and B: Isotopic distribution of tryptic fragments of spot number 1 (Figure 2A), having a mass of 1,140 and 2,014, isolated from WS proteins of normal lenses. C and D: Isotopic distribution of tryptic fragments from spot number 2 (Figure 2A), having a mass of 1,140 and 2,014, isolated from WS proteins of normal lenses.
