![]() Figure 4 of
Fernandez-Durango, Mol Vis 2003;
9:103-109.
Figure 4 of
Fernandez-Durango, Mol Vis 2003;
9:103-109.
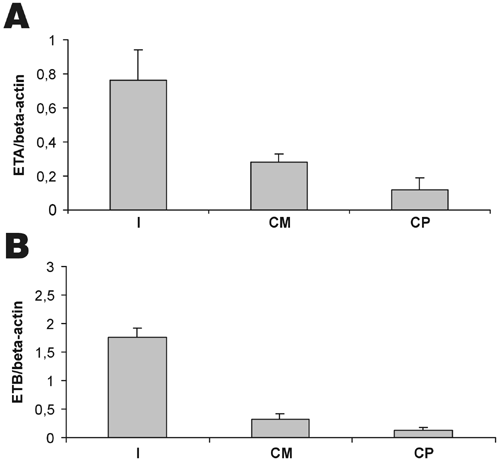
Figure 4. ETA and ETB gene expression in the human anterior segment
Quantification by real time RT-PCR of ETA and ETB expression in human iris, ciliary muscle (CM) and ciliary processes (CP). A: ETA expression in iris, CM and CP was normalized to β-actin expression levels in the same cDNA samples. B: ETA expression in iris, CM and CP was normalized to β-actin expression levels in the same cDNA samples. The bars represent the mean; the error bars represent the standard deviation.
