![]() Figure 1 of
Armstrong, Mol Vis 2003;
9:74-79.
Figure 1 of
Armstrong, Mol Vis 2003;
9:74-79.
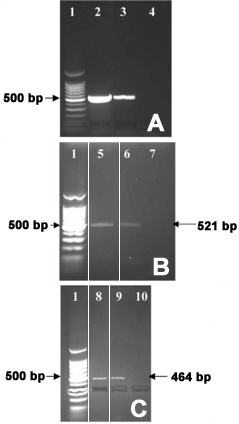
Figure 1. Reverse transcriptase polymerase chain reaction (RT-PCR) of thrombospondin isoforms in collagen-seeded keratocytes
Agarose gels (2%) showing PCR products, after RT-PCR was carried out on RNA isolated from cultured keratocytes seeded in collagen matrices. Products in lanes 2, 5, and 8 were derived from RNA isolated from collagen gels that had been in culture medium for 1 day, lanes 3, 6, and 9 were derived from RNA isolated from collagen gels that had been in culture medium for 7 days. All gels show 10 μl of 100 bp DNA ladder (lane 1) and 18 μl of PCR product (lanes 2-10). A: Appropriate bands for the housekeeping gene GAPDH (500 bp) in lanes 2 and 3, but not in lane 4 (RT-PCR negative control). B: Appropriate bands for TSP-2 (521 bp) in lanes 5 and 6, but not in lane 7 (RT-PCR negative control). C: Appropriate bands for TSP-3 (464 bp) in lanes 8 and 9, but not in lane 10 (RT-PCR negative control). No TSP-4 or COMP was found to be present (figure not included).