![]() Figure 7 of
Perkins, Mol Vis 2003;
9:60-73.
Figure 7 of
Perkins, Mol Vis 2003;
9:60-73.
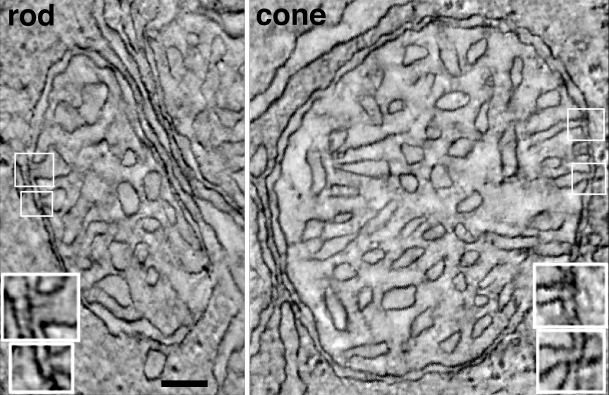
Figure 7. Slices through mitochondria from rod and cone tomographic reconstructions
These slices show the expected orthodox conformation in situ. Each slice is 2.2 nm thick. Examples of the mitochondrial crista junctions are boxed. The insets are shown at twice the normal magnification and emphasize the variation in the widths of openings within and between each photoreceptor cell type. Scale bar represents 100 nm.