![]() Figure 2 of
Perkins, Mol Vis 2003;
9:60-73.
Figure 2 of
Perkins, Mol Vis 2003;
9:60-73.
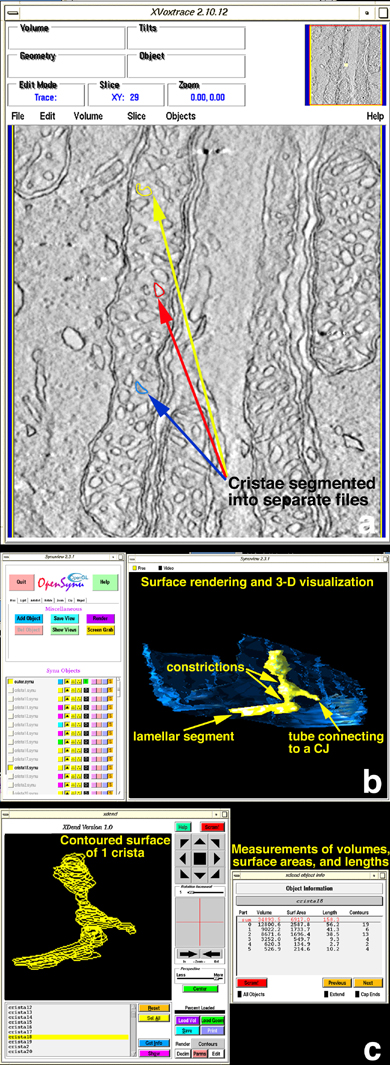
Figure 2. Quantitative analysis of mitochondrial substructures
A: Use of XVoxtrace. The software program XVoxtrace allows volume segmentation, as shown here for a cone mitochondrion. Segmentation is based on membrane topography and separates individual cristae, inner boundary and outer membranes. The separate tracings of three cristae are shown in yellow, red and blue. B: Use of Synuview. Using the software program Synuview, individual or any combination of cristae surfaced-rendered can be displayed in order to visualize their 3-D shapes and membrane architecture in user-defined orientations. This program was used to classify the structural motifs of lamellae, tubes, crista junctions, and constrictions. A crista showing all of these elements is displayed in yellow. The outer membrane is shown in blue. C: Use of XDend. Measurements of surface-rendered elements permitted a comparison of substructures inside mitochondria using the program XDend. A contoured crista is shown on the left. On the right, a table of numerical values associated with volume, surface area, length, and number of contours is displayed for the crista on the left.