![]() Figure 3 of
Schulz, Mol Vis 2002;
8:67-71.
Figure 3 of
Schulz, Mol Vis 2002;
8:67-71.
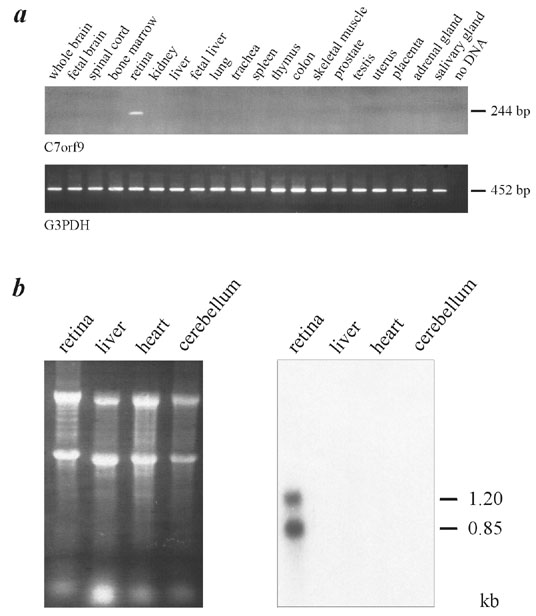
Figure 3. Expression analysis of C7orf9
A: RT-PCR analysis of C7orf9 was done using RNA from 20 different tissues. Primer pair A129F3 and A129R amplified a 244 bp product from only retina, as seen on the ethidium bromide-stained agarose gel. As a positive control, primers G3PDH-ex8F/G3PDH-ex9R amplified a 452 bp product from the ubiquitous gene glyceraldehyde-3-phosphate dehydrogenase from all tissues. B: RNA from different tissues was separated on a formaldehyde agarose gel and stained with ethidium bromide (left). The resulting Northern blot was probed with an a32P-dCTP-labeled PCR product amplified by A129F3 and A129R. Two signals at approximately 1.2 kb and 0.85 kb were detected in retina, but not in the other tissues tested.