![]() Figure 8 of
Wagner, Mol Vis 2002;
8:59-66.
Figure 8 of
Wagner, Mol Vis 2002;
8:59-66.
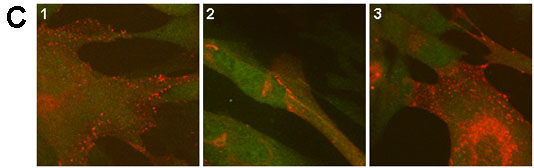
Figure 8. Gap junction plaques in N/N 1003A cells overexpressing PKCa
A: Graphical representation of the average number of gap junction plaques per square micrometer. N/N 1003A cells overexpressing PKCa showed a significant increase in gap junction plaques compared to control N/N 1003A cells (transfected with empty-vector, n=10) at all time points tested. B: Disassembly of Cx43 Plaques as a Result of PKCg, not PKCa Overexpression. Graphical representation of the average number of gap junction plaques per square micrometer. Comparing cells overexpressing PKCg and cells overexpressing PKCa over the four time periods, there was a significant (p<0.05) decrease in gap junction plaques in cells overexpressing PKCg at all time points tested. C: Confocal images showing a decrease in gap junction plaques (red) in N/N 1003A cells overexpressing PKCgand an increase in gap junction plaques in N/N 1003A cells overexpressing PKCa. The images show Cx43 gap junction plaques at 7 days overexpression. Image 1 shows control N/N 1003A cells, image 2 shows N/N 1003A cells overexpressing PKCg for 7 days, and image 3 shows N/N 1003A cells overexpressing PKCa for 7 days.