![]() Figure 7 of
Wagner, Mol Vis 2002;
8:59-66.
Figure 7 of
Wagner, Mol Vis 2002;
8:59-66.
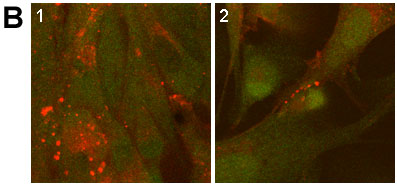
Figure 7. Disassembly of Cx43 plaques as a result of long-term PKCg overexpression
A: Graphical representation of the average number of gap junction plaques per square micrometer. N/N 1003A cells overexpressing PKCg showed a significant decrease in gap junction plaques compared to control N/N 1003A cells (transfected with empty-vector, n=10). All of the cells overexpressing PKCg showed a significantly smaller response than control. All cells received 20 mM of zinc acetate. B: Confocal images show a decrease in gap junction plaques (red) in N/N 1003A cells overexpressing PKCg. The image depicts Cx43 gap junction plaques at 7 days overexpression of PKCg. Image 1 shows control N/N 1003A cells (transfected with empty-vector) and image 2 shows N/N 1003A cells overexpressing PKCg for 7 days.