![]() Figure 6 of
Wagner, Mol Vis 2002;
8:59-66.
Figure 6 of
Wagner, Mol Vis 2002;
8:59-66.
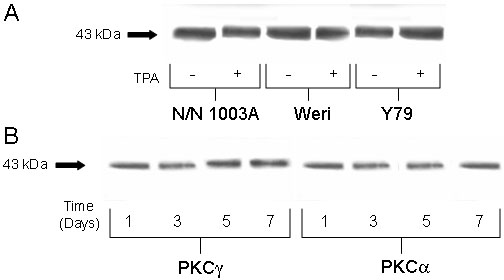
Figure 6. Western blot analysis showing total Cx43 protein
A: Western blot analysis of 1.0x10⁶ cells treated with or without 200 nM TPA for 60 min. Each lane was loaded with 20 mg of protein. The blot was probed with anti-Cx43 antibody overnight. There was not a significant difference between TPA-treated N/N 1003A, Weri, or Y79 cells compared to matched control cells without TPA for the three cell types. Although there was a decrease in gap junction plaques at the surface in both lens epithelial cells and retinal cells, there was not any decrease in total cell Cx43 protein. B: Western blot analysis of 1.0x10⁶ cells overexpressing PKCa or PKCg for up to 7 days. Each lane was loaded with 20 mg of protein. The blot was probed with anti-Cx43 antibody overnight. Although there was a decrease in gap junction plaques at each time of PKCg overexpression, and an increase in gap junction plaques at each time of PKCa overexpression, there was not any change in total cell Cx43 protein for up to 7 days of overexpression.