![]() Figure 5 of
Wagner, Mol Vis 2002;
8:59-66.
Figure 5 of
Wagner, Mol Vis 2002;
8:59-66.
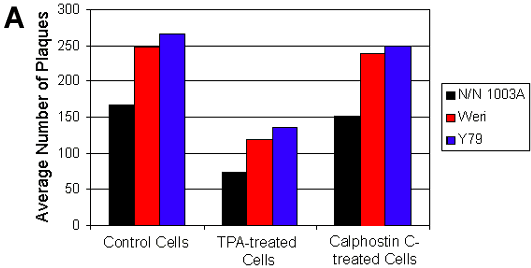
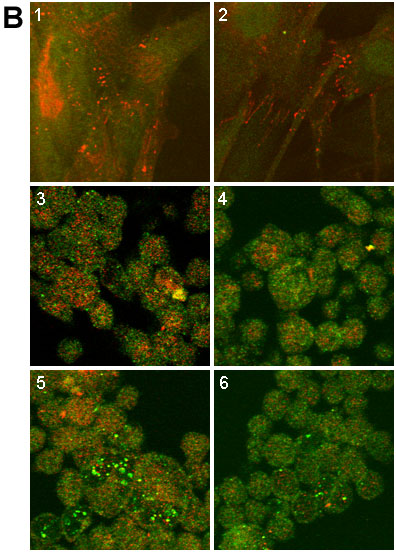
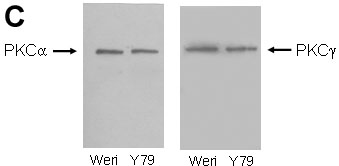
Figure 5. Cx43 plaques in N/N 1003A cells in response to TPA or Calphostin C
A: A graphical representation of the average number of gap junction plaques per square micrometer. N/N 1003A cells (untransfected) treated with TPA (200 nM for 60 min, n=10) showed a 56% decrease in gap junction plaques compared to control N/N 1003A cells (n=10). Weri cells treated with TPA (200 nM for 60 min, n=7) showed a 52% decrease in gap junction plaques compared to control Weri cells (n=8), while Y79 cells treated with TPA (200 nM for 60 min, n=8) showed a 49% decrease in gap junction plaques compared to control Y79 cells (n=7). TPA treated cells demonstrated a significantly (p<0.05) smaller response than the control. B: Confocal images show a decrease in gap junction plaques (red) in TPA-treated N/N 1003A, Weri, and Y79 cells compared to control cells from each cell type. Image 1: Control N/N 1003A cells (not transfected). Image 2: TPA-treated N/N 1003A cells. Image 3: Control Weri cells. Image 4: TPA-treated Weri cells. Image 5: Control Y79 cells. Image 6: TPA-treated Y79 cells. C: Western blots (25 mg of protein per lane) of Weri and Y79 retinal whole cell homogenates show the presence of both PKCa and PKCg. Blots are from 12.5% SDS-PAGE treated with anti-PKCa or anti-PKCg at 1:1000 dilution (Transduction Labs). The blots were visualized using ECL.