![]() Figure 4 of
Wagner, Mol Vis 2002;
8:59-66.
Figure 4 of
Wagner, Mol Vis 2002;
8:59-66.
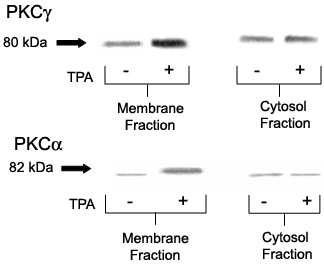
Figure 4. PKCg and PKCa translocation to the cell membrane
TPA (200 nM) was added to untransfected N/N 1003A cells (1.0x10⁶) for 60 min. The membrane and cytosolic fractions were separated by centrifugation at 35,000 rpm (100,000x g) for 1 h at 4 °C. There was an increase in both PKCg and PKCa in the membrane fraction of TPA-treated cells while the control cells showed no translocation of PKCg or PKCa to membrane fractions compared to the cytosolic fraction (20 mg of protein per lane). There was an approximately 61% increase in membrane-bound PKCg and an approximately 68% increase in membrane-bound PKCa in the TPA-treated cells. Percent membrane bound was calculated by density scanning using Scion Image.