![]() Figure 1 of
Wagner, Mol Vis 2002;
8:59-66.
Figure 1 of
Wagner, Mol Vis 2002;
8:59-66.
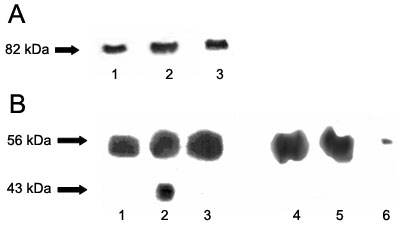
Figure 1. Immunoprecipitation of PKCg and PKCa with Cx43
A: PKCg was immunoprecipitated in control N/N1003A cells (transfected with empty vector, lane 1) and in N/N1003A which over express PKCg (lane 2). As a control, PKCa was immunoprecipitated in N/N1003A cells which over express PKCa (lane 3). B: Immunoprecipitated proteins were analyzed on 12.5% SDS-PAGE and western blot, then the nitrocellulose membranes which contain the transferred proteins were probed with anti Cx43 antibodies and visualized using chemiluminescent secondary antisera (IgG). The higher molecular weight bands (greater than 56 kDa) represent precipitated immunoglobulins (primary antisera) reactive with the secondary antisera and they were also detected in control experiments (lanes 4 and 5). All cells recieved 20 mM zinc-acetate at the start of the experiment and were allowed to overexpress for 24 h. Lane 1: Control cells precipitated with anti-PKCg antibodies (Transduction Labs; 1:1000 dilution) and Western blots probed with anti-Cx43 (Chemicon; 1:1000 dilution). Lane 2: Cells overexpressing PKCg were immunoprecipitated with anti-PKCg then probed with anti-Cx43. Lane 3: Cells overexpressing PKCa were immunoprecipitated with anti-PKCa and probed with anti-Cx43. Lane 4: PKCg antisera and Protein A alone, probed with anti Cx43, then secondary antisera. Lane 5: Primary antisera added directly to gel lane and probed with anti-Cx43 and secondary antisera. Lane 6: Protein A alone probed with anti-Cx43. Thus, the primary antisera band at 56 kD is observed in all samples to which it was added. All lanes visualized with anti-IgG-ECL (Pierce).