![]() Figure 2 of
Kyveris, Mol Vis 2002;
8:51-58.
Figure 2 of
Kyveris, Mol Vis 2002;
8:51-58.
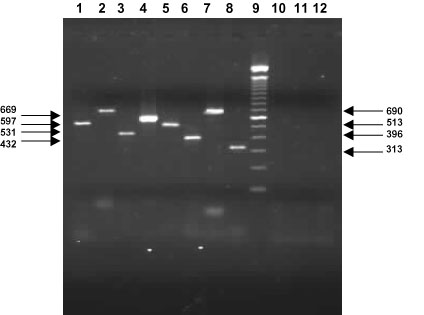
Figure 2. Survey of prostanoid receptor mRNA expression in human optic nerve tissue
Representative ethidium bromide staining of prostanoid receptor mRNA amplification products obtained from 1.0 mg of total RNA from human optic nerve tissue run at 35 cycles of PCR and resolved by electrophoresis. RT-PCR amplification products representing: Lane 1: DP receptor mRNA (531 bp); Lane 2: EP1 receptor mRNA (669 bp); Lane 3: EP2 receptor mRNA (432 bp); Lane 4: EP3 receptor mRNA (597 bp); Lane 5: EP4 receptor mRNA (513 bp); Lane 6: FP receptor mRNA (396 bp); Lane 7: IP receptor mRNA (690 bp); Lane 8: TP receptor mRNA (313 bp); Lane 9: 100 bp DNA molecular weight ladder; Lane 10: representative negative control where the RT reaction was carried out in the absence of reverse transcriptase enzyme; Lane 11: representative negative control where the RT reaction was carried out in the absence of total RNA; Lane 12: representative PCR amplification of 1.5 ng of human genomic DNA. Arrows mark the approximate position of each prostanoid receptor mRNA amplification product. Representative of 3 experiments.