![]() Figure 3 of
Runkle, Mol Vis 2002;
8:45-50.
Figure 3 of
Runkle, Mol Vis 2002;
8:45-50.
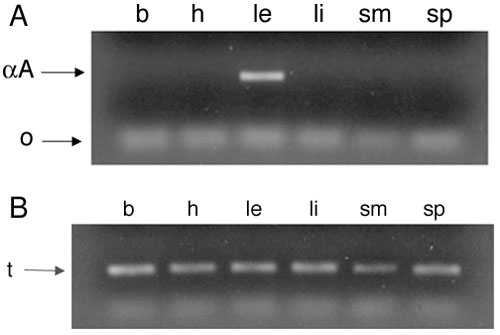
Figure 3. RT-PCR analysis of aA-crystallin expression at 25 cycles
Zebrafish total RNA (150 ng) was isolated from various tissues, reverse transcribed and amplified for 25 cycles. Ethidium bromide stained gels show levels of aA-crystallin and tubulin expression in brain (b), heart (h), lens (le), liver (li), skeletal muscle/skin (sm) and spleen (sp). In panel A, arrows indicate the aA-crystallin product (aA) and unincorporated oligonucleotides (o). In panel B, arrows indicate the tubulin control product (t).