![]() Figure 6 of
Liou, Mol Vis 2002;
8:483-493.
Figure 6 of
Liou, Mol Vis 2002;
8:483-493.
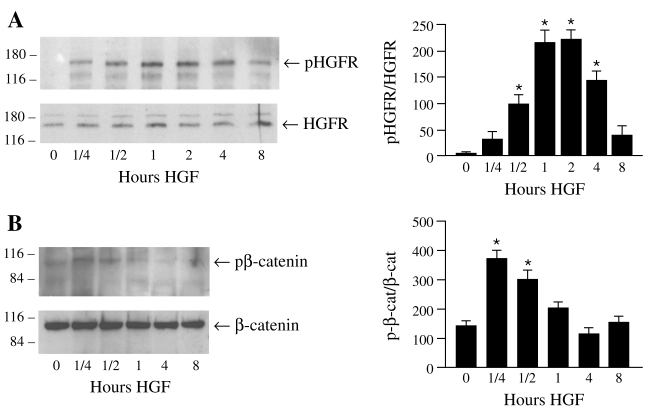
Figure 6. Kinetics of HGF induced tyrosine phosphorylation of HGFR and β-catenin in ARPE-19 cells
Sub-confluent cells were treated with HGF for indicated times and lysed. Protein equivalent aliquots of cell lysates from each time point were immunoprecipitated with anti-HGFR or anti-β-catenin antibody and then analyzed by western blot using anti-phosphotyrosine antibody. The membrane was stripped and analyzed with anti-HGFR or anti-β-catenin antibody. A: Immunoprecipitation with anti-HGFR and then western blot analysis with anti-phosphotyrosine (top), and with anti-HGFR (bottom) antibodies. B: Immunoprecipitation with anti-β-catenin and then western blot analysis with anti-phosphotyrosine (top) and with anti-β-catenin (bottom) antibodies. pHGFR indicates phosphorylated HGFR and pβ-catenin indicates phosphorylated β-catenin. The positions and the molecular weight (kD) of protein markers are indicated. Bars indicate the mean and standard deviation of three independent experiments. Asterisks indicate level of statistical significance for p<0.05.