![]() Figure 3 of
Liou, Mol Vis 2002;
8:483-493.
Figure 3 of
Liou, Mol Vis 2002;
8:483-493.
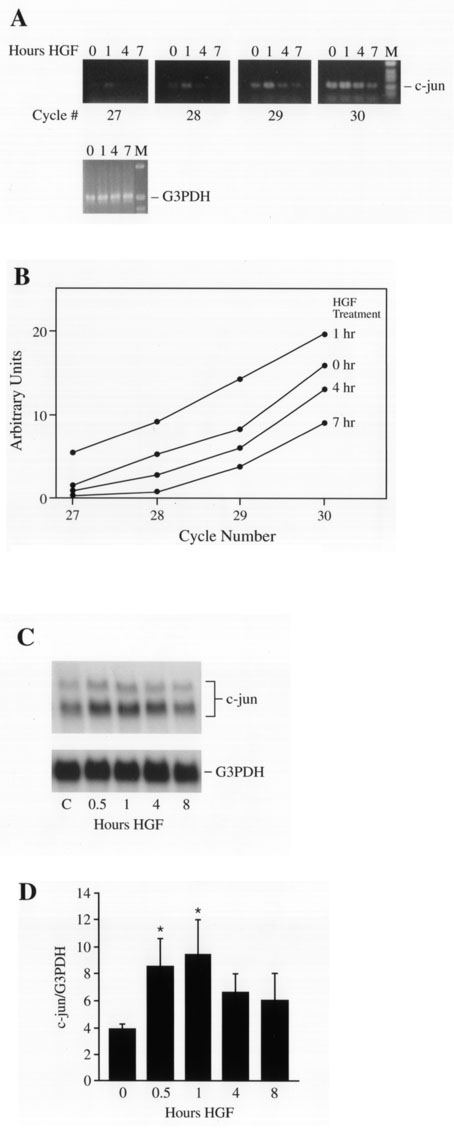
Figure 3. HGF induced c-jun expression in ARPE-19 cells
Sub-confluent cells were treated with HGF for indicated times. "0" or "C" indicates untreated, control cells. Total RNA equivalent aliquots of cells from each time point were analyzed by semi-quantitative RT-PCR or by northern blot analysis. A,B: Kinetics of the semi-quantitative RT-PCR assay. Oligo-dT-primed cDNAs from cells treated with HGF for the times indicated were subjected to PCR using primers specific for c-jun. Aliquots taken after selected numbers of cycles were analyzed by gel electrophoresis. PCR reactions in the presence of primers for glyceraldehyde-3-phosphate dehydrogenase (G3PDH, an internal standard) were performed for 27 cycles and electrophoresed in parallel. C,D: Northern blot analysis using antisense riboprobes for c-jun and kinetics of the densitometry quantified c-jun/G3PDH level of expression after HGF treatment. Bars indicate the mean and standard deviation of three independent experiments. Asterisks indicate level of statistical significance for p<0.05.