![]() Figure 2 of
Zaidi, Mol Vis 2002;
8:472-476.
Figure 2 of
Zaidi, Mol Vis 2002;
8:472-476.
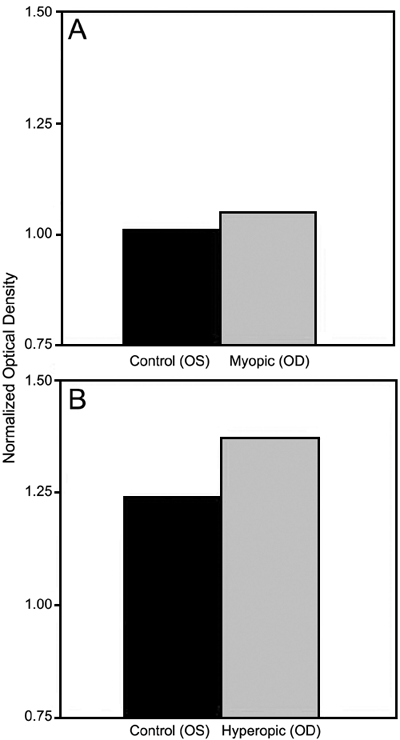
Figure 2. Medians of normalized data for αA-crystallin from treated (OD) and control (OS) lens samples
A: The OS and OD group medians were 1.01 and 1.05 respectively. Statistical analysis (Wilcoxon Signed Rank Test, p=0.90) revealed no significant difference in αA-crystallin concentration in lenses from form-deprived myopic (OD) and control (OS) eyes. B: The OS and OD group medians were 1.24 and 1.37 respectively. Statistical analysis (Wilcoxon Signed Rank Test, p=0.54) revealed no significant difference in αA-crystallin concentration in lenses from eyes induced with hyperopia (OD) versus control eyes (OS). Statistical analysis (Mann-Whitney, p=0.70) revealed no significance in the difference of medians between the myopic and hyperopic study.