![]() Figure 1 of
Zaidi, Mol Vis 2002;
8:472-476.
Figure 1 of
Zaidi, Mol Vis 2002;
8:472-476.
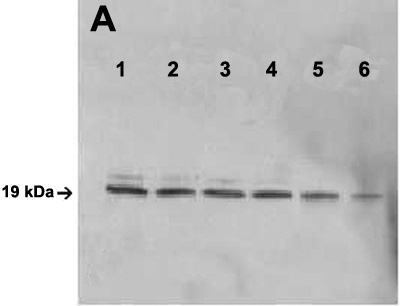
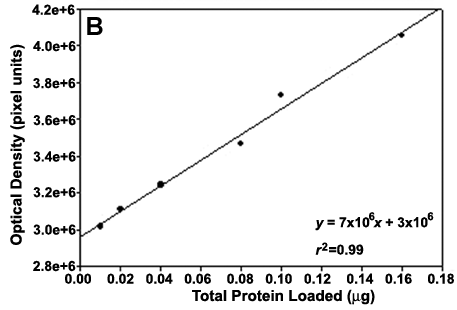
Figure 1. Linear range of optical density as a function of chick lens total soluble protein for αA-crystallin
A: Western blot of αA-crystallin from decreasing concentration of lens total soluble protein. The amount of crystallin in each lane was; lane 1: 0.16 μg; lane 2: 0.10 μg; lane 3: 0.08 μg; lane 4: 0.04 μg; lane 5: 0.02 μg; lane 6: 0.01 μg. Non-specific binding to αB-crystallin is present as faint bands immediately above the αA-crystallin band. B: Each band in lanes 1 to 6 of the western blot in A were quantified and represented graphically as optical density versus increasing protein concentration.