![]() Figure 3 of
Wunderlich, Mol Vis 2002;
8:431-435.
Figure 3 of
Wunderlich, Mol Vis 2002;
8:431-435.
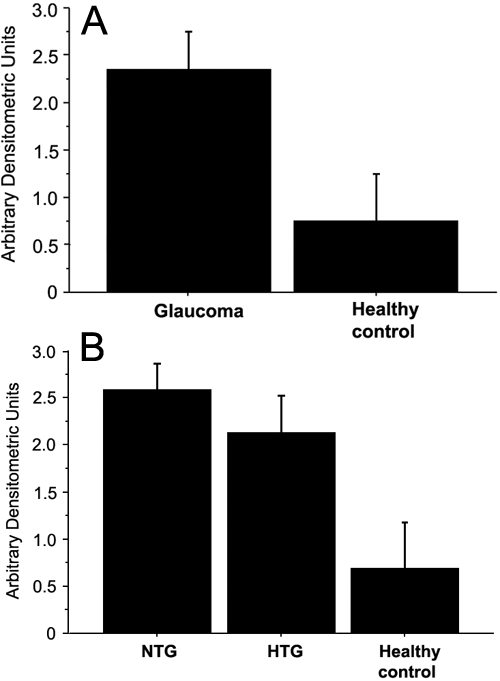
Figure 3. Quantification of 20S proteasome α-subunit levels
A: Densitometric quantification of the protein levels of the 20S proteasome α-subunit in leucocytes of glaucoma patients versus healthy controls. B: Comparison of the protein levels of the 20S proteasome α-subunit in leukocytes from patients with NTG, HTG, and healthy controls. Both diagrams represent the means and standard deviations of three independent experiments in Arbitrary Densitometric Units.
