![]() Figure 2 of
Wunderlich, Mol Vis 2002;
8:431-435.
Figure 2 of
Wunderlich, Mol Vis 2002;
8:431-435.
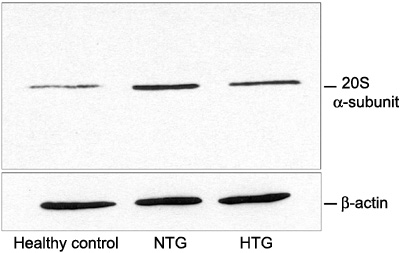
Figure 2. Comparison of 20S proteasome α-subunit protein levels
20S proteasome α-subunit protein levels of patients with NTG, HTG, and a healthy control. Western blotting against β-actin of the same membrane was used as an internal control for loading.
