![]() Figure 2 of
Kennedy, Mol Vis 2002;
8:422-430.
Figure 2 of
Kennedy, Mol Vis 2002;
8:422-430.
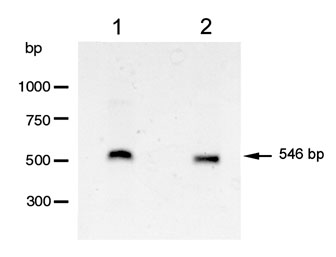
Figure 2. RT-PCR analysis of mdr1 expression in human RPE
Agarose gel electrophoresis of PCR products amplified with mdr1-specific primers and using cDNA prepared from cultured human RPE (lane 1: cells were second passage, extracted nine days after plating) and from D407 cells (lane 2). In the respective samples, a single band of the size expected size (about 546 bp) was obtained. Direct sequencing of the purified PCR DNAs confirmed their identity as mdr1 DNAs.