![]() Figure 6 of
Vittitow, Mol Vis 2002;
8:32-44.
Figure 6 of
Vittitow, Mol Vis 2002;
8:32-44.
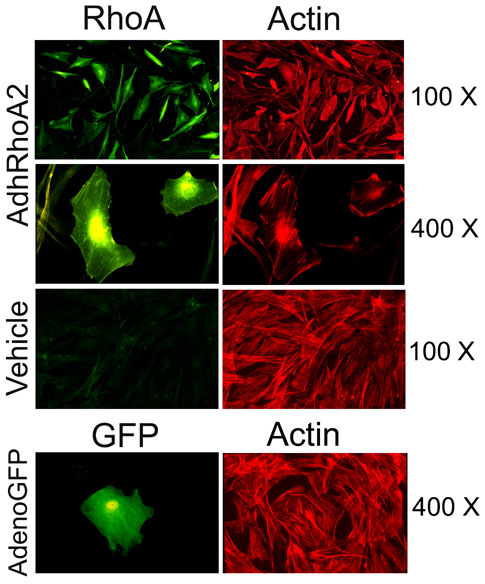
Figure 6. Changes in the distribution of F-actin in HTM cells infected with AdhRhoA2
HTM cells were exposed to 100 pfu/cell of AdhRhoA2, vehicle or 100 pfu/cell of AdenoGFP. At 48 h post-treatment, cells were fixed, permeabilized and processed for immunofluorescence. Cells treated with AdhRhoA2 and vehicle were double-stained with a rabbit anti-human antibody for RhoA followed by FITC-conjugated goat anti-rabbit secondary antibody and TRITC conjugated phalloidin. Cells infected with AdenoGFP were stained with TRITC-conjugated phalloidin. Panels were visualized with the fluorescein (left, RhoA and GFP) and rhodamine (right, actin) channels. Actin stress fibers are clearly reduced in AdhRho2 infected cells while appeared well formed in those cells infected with AdenoGFP. Original magnification 400x.