![]() Figure 3 of
Rengarajan, Mol Vis 2002;
8:416-421.
Figure 3 of
Rengarajan, Mol Vis 2002;
8:416-421.
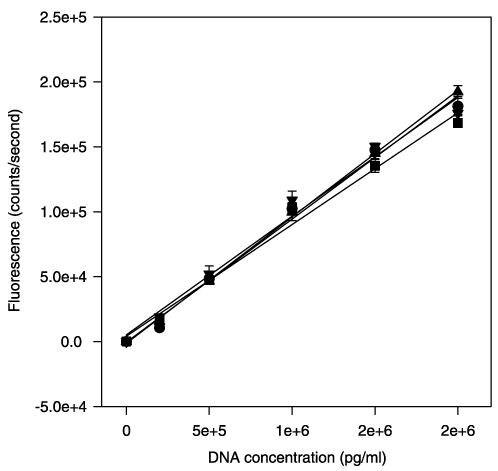
Figure 3. Inter-assay variability
The repeatability of the DNA fluorescence assay was tested using SYBR Green I (four lots from three suppliers). The graphs show the means of the observed data with error bars and the linear regression models for the relationship between DNA concentration and observed fluorescence enhancement for each lot. The coefficients of variation for the assay ranged from 4.6% to 11%.
