![]() Figure 5 of
Wagner, Mol Vis 2002;
8:394-406.
Figure 5 of
Wagner, Mol Vis 2002;
8:394-406.
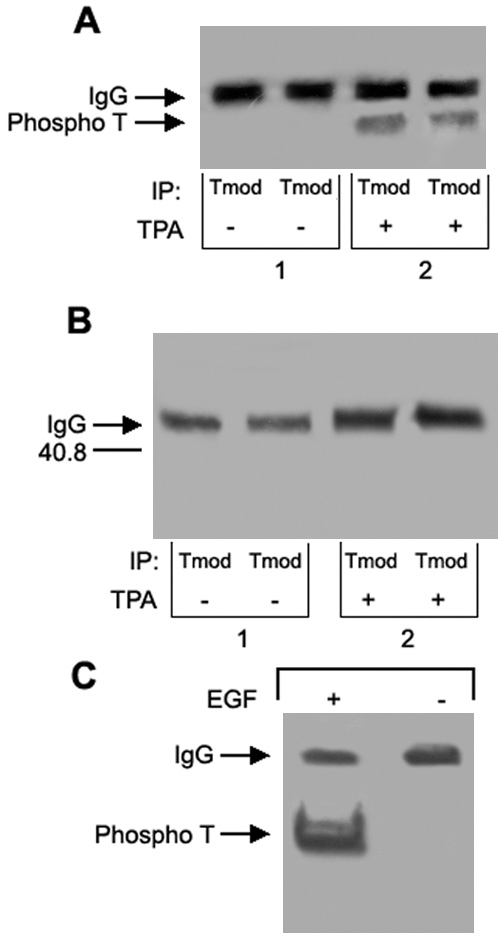
Figure 5. Phosphorylation of tropomodulin on threonine
Tropomodulin was co-immunoprecipitated from duplicate samples of N/N 1003A cells or N/N 1003A cells treated with either 200 nM TPA for 60 min. The blots were probed with either anti-phosphothreonine antibody (A) or anti-phosphoserine antibody (B). A: Blots probed with anti-phosphothreonine antibody. Only cells treated with TPA had stimulated threonine phosphorylation of tropomodulin (group 2) while there was no threonine phosphorylation of tropomodulin in control samples (group 1). B: Blots probed with anti-phosphoserine antibody. There was not any evidence of serine phosphorylation of tropomodulin for any of the sample groups. C: Tropomodulin was co-immunoprecipitated from N/N 1003A cells and EGF-stimulated N/N 1003A cells. The blot was probed with anti-phosphothreonine antibody. Cells treated with EGF showed a heavy band representing phosphothreonine (lane 1) while control cells did show a band for phosphothreonine (lane 2).