![]() Figure 4 of
Wagner, Mol Vis 2002;
8:394-406.
Figure 4 of
Wagner, Mol Vis 2002;
8:394-406.
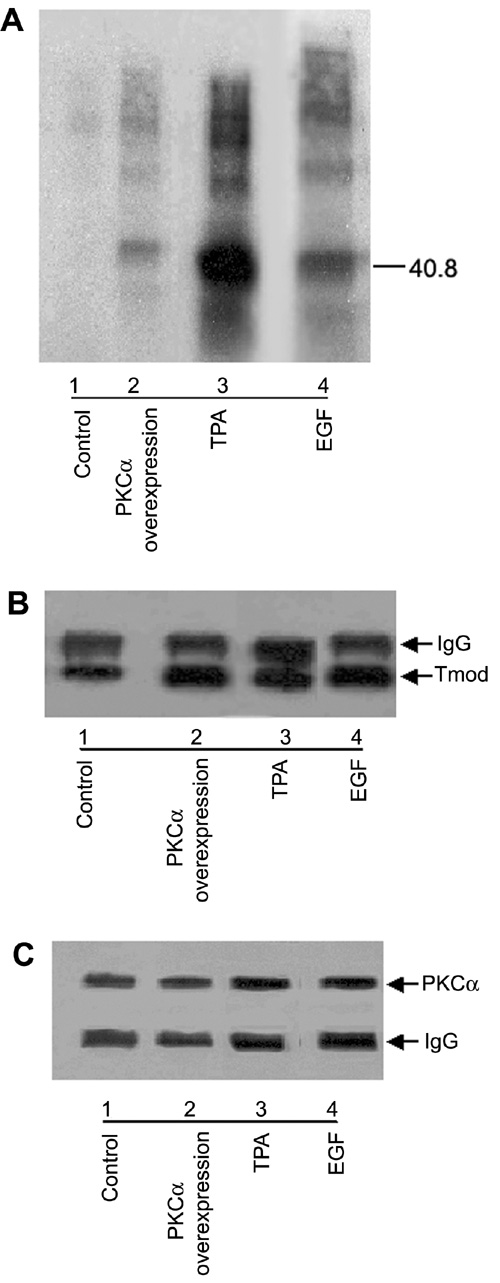
Figure 4. Phosphorylation of tropomodulin by PKCα in vitro
Tropomodulin was immunoprecipitated from control and treated cells. With the immunoprecipitated tropomodulin and co-immunoprecipitated PKCα still attached to the Protein G sepharose beads, an in vitro [γ-32P] PKC activity assay was carried out. A: Autoradiogram of the nitrocellulose membrane demonstrating a very heavy band at about 40 kD representing phosphorylated tropomodulin for cells treated with TPA (lane 3). Cells treated with EGF (lane 4) and cells overexpressing PKCα (lane 2) also had an increase in phosphorylated tropomodulin compared to control cells (lane 1). B: The same blot was then probed with anti-tropomodulin antibody. TPA-treated cells had the most immunoprecipitated tropomodulin (lane 3) while cells treated with EGF (lane 4) and cells overexpressing PKCα (lane 2) showed more immunoprecipitated tropomodulin than control cells (lane 1). C: PKCα was immunoprecipitated from control cells, N/N 1003A cells treated with 200 nM TPA for 60 min, 10 ng/ml EGF for 15 min, or N/N 1003A cells overexpressing PKCα for 7 days. The Western blot was probed with anti-PKCα antibody. TPA-treated cells had the most co-immunoprecipitated PKCα (lane 3) while cells treated with EGF (lane 4) and cells overexpressing PKCα (lane 2) showed more co-immunoprecipitated PKCα than control cells (lane 1).