![]() Figure 3 of
Wagner, Mol Vis 2002;
8:394-406.
Figure 3 of
Wagner, Mol Vis 2002;
8:394-406.
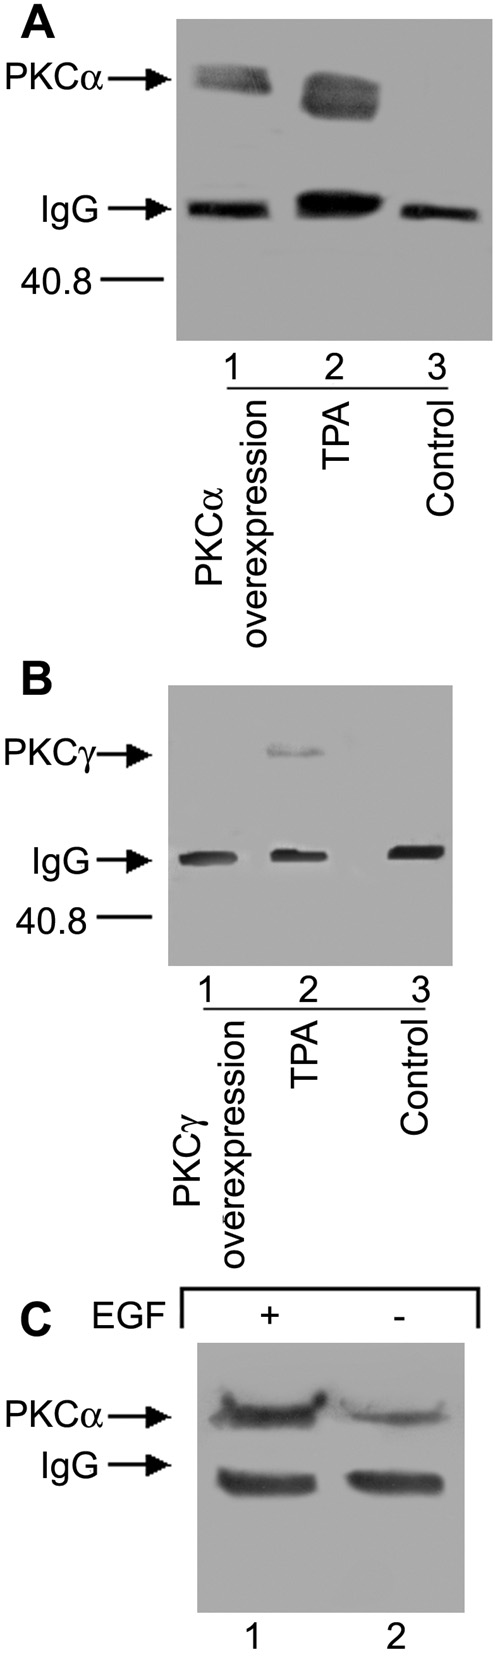
Figure 3. Co-immunoprecipitation of PKCα but not PKCγ with tropomodulin
A: Tropomodulin was immunoprecipitated from N/N 1003A lens epithelial cells, N/N 1003A cells treated with either 200 nM TPA for 60 min, or N/N 1003A cells overexpressing PKCα for 7 days and the blot probed with anti-PKCα antibody. Cells overexpressing PKCαand TPA-treated cells demonstrated interaction of PKCα with tropomodulin (lanes 1 and 2) compared to control cells (lane 3). B: Tropomodulin was immunoprecipitated from N/N 1003A lens epithelial cells, N/N 1003A cells treated with either 200 nM TPA for 60 min, or N/N 1003A cells overexpressing PKCγ for 7 days and the blot probed with anti-PKCγ antibody. Cells overexpressing PKCγ for 7 days showed no interaction of tropomodulin with PKCγ (lane 1). For TPA-treated cells, a small band at about 78 kD representing PKCγ appeared, thus demonstrating slight co-immunoprecipitation (lane 2). C: Tropomodulin was immunoprecipitated from N/N 1003A lens epithelial cells and EGF-stimulated cells and the blot probed with anti-PKCα antibody. EGF-treated cells demonstrated increased interaction of PKCα with tropomodulin (lane 1) compared to control cells (lane 2).