![]() Figure 2 of
Wagner, Mol Vis 2002;
8:394-406.
Figure 2 of
Wagner, Mol Vis 2002;
8:394-406.
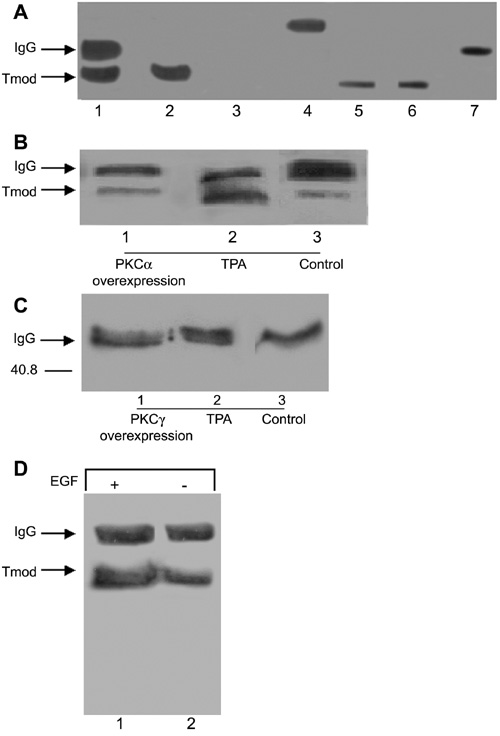
Figure 2. Interaction of PKCα but not PKCγ with tropomodulin
PKCα (B) or PKCγ (C) was co-immunoprecipitated from treated N/N 1003A lens epithelial cells and Western blot analysis was performed (20 μg protein/lane). A: Immunoprecipitation controls for tropomodulin to determine correct migration of the tropomodulin band and IgG band (20 μg of protein/lane). Lane 1: Positive control for the immunoprecipition. The immunoprecipitate reaction consisted of cell lysate, Protein G sepharose beads, and primary antibody (anti-tropomodulin). From this reaction an IgG band at about 50 kD and a band at about 43 kD representing tropomodulin were seen. Lane 2: Negative control for IgG. This consisted of only cell lysate added to the reaction mixture. A band representing tropomodulin was present at about 43 kD, but no IgG band was seen. Lane 3: Negative control for both IgG and anti-tropomodulin antibody. This consisted of only Protein G sepharose beads, but no cell lysate or primary antibody (anti-tropomodulin). For this reaction, no bands were apparent for IgG or the tropomodulin. Lane 4: Positive control for the tropomodulin antibody. This consisted of only Protein G sepharose beads and primary antibody (anti-tropomodulin) with the absence of cell lysate. Only a band representing the primary antibody appeared at about 50 kD. Lanes 5 and 6: Positive controls for tropomodulin. Recombinant chicken tropomodulin (2 μg; Fowler) and N/N 1003A cells (20 μg protein) were run on SDS-PAGE gels and transferred onto nitrocellulose. A band for tropomodulin appeared at about 43 kD for both samples. Lane 7: Positive control for the tropomodulin antibody. Tropomodulin antibody was mixed with SDS-PAGE sample buffer and run on a SDS-PAGE gel and transferred onto nitrocellulose. A band representing the primary antibody appeared at about 50 kD. B: PKCα was immunoprecipitated and the blot was probed with anti-tropomodulin antibody. Immunoprecipitates from TPA-treated cells demonstrated the most interaction with tropomodulin antibody (lane 2) compared to control cells (lane 3). A slight interaction between PKCα and tropomodulin was noted in cells overexpressing PKCα for 7 days (lane 1). C: PKCγ was immunoprecipitated and the blot was probed with anti-tropomodulin antibody. This experiment demonstrated that there was a lack of interaction between PKCγ and tropomodulin. Reactive bands for tropomodulin did not appear for cells treated with TPA, for cells overexpressing PKCγ for 7 days, or for control cells (lanes 1-3). D: Activation by EGF caused an increase in PKCα-tropomodulin interaction. Cells were treated with EGF and PKCα was immunoprecipitated. The blot was probed with anti-tropomodulin antibody. Immunoprecipitates from EGF-treated cells demonstrated the most interaction with tropomodulin antibody (lane 1) compared to control cells (lane 2).