![]() Figure 1 of
Wagner, Mol Vis 2002;
8:394-406.
Figure 1 of
Wagner, Mol Vis 2002;
8:394-406.
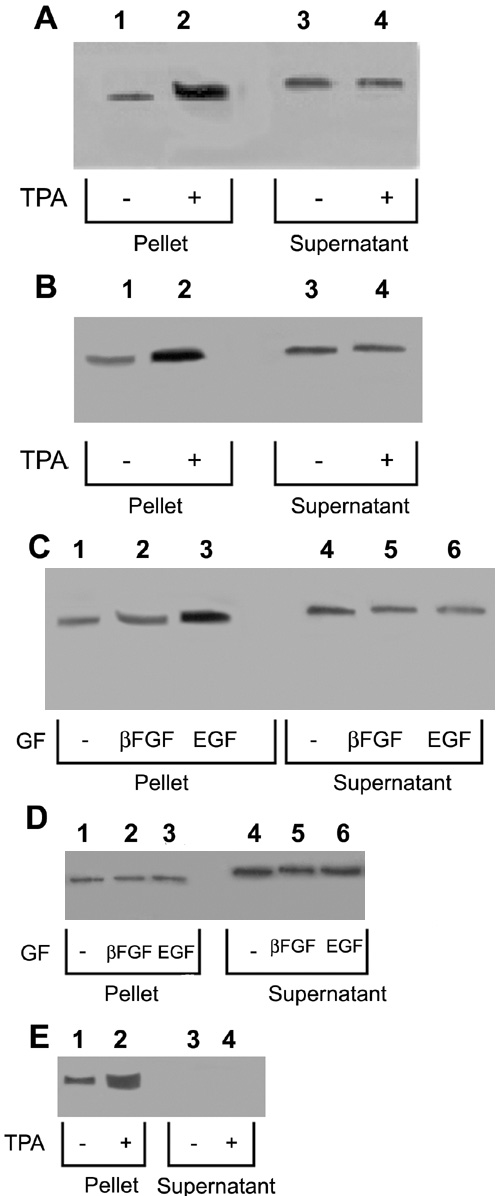
Figure 1. Western blot analysis of PKCα, PKCγ, and tropomodulin localization
Control or treated N/N 1003A lens epithelial cells were taken up in ice cold 50 mM Tris, 20 mM MgCl2, pH 7.5 and the lysate was centrifuged for 60 min at 35,000 rpm (100,000x g). Western blot analysis (25 μg protein/lane) was performed on the pellet and supernatant fractions. A and B: Western blot analysis of PKCα(A) and PKCγ (B) translocation after activation by TPA. Upon activation of PKCα or PKCγ by TPA, both PKCα and PKCγ translocated from the cytosol to the plasma membrane (A and B, lane 2 versus lane 4). There was not any translocation of the either enzyme in control cells (A and B, lane 1 versus lane 3). C and D: Western blot analysis of PKCα (C) and PKCγ (D) translocation after the addition of EGF and bFGF. EGF activated PKCα which is shown by the translocation of the enzyme from the supernatant fraction to the pellet fraction containing the plasma membrane (C, lane 3 versus lane 6) while EGF caused no translocation of PKCγ (D, lane 3 versus lane 6). bFGF did not cause the translocation of either PKC isoform (C, lane 2 versus lane 5; D, lane 2 versus lane 5). E: Localization of tropomodulin (Tmod) in N/N 1003A cells. Tropomodulin was found only in the pellet fractions that contained the plasma membrane in all samples.