![]() Figure 9 of
Chen, Mol Vis 2002;
8:372-388.
Figure 9 of
Chen, Mol Vis 2002;
8:372-388.
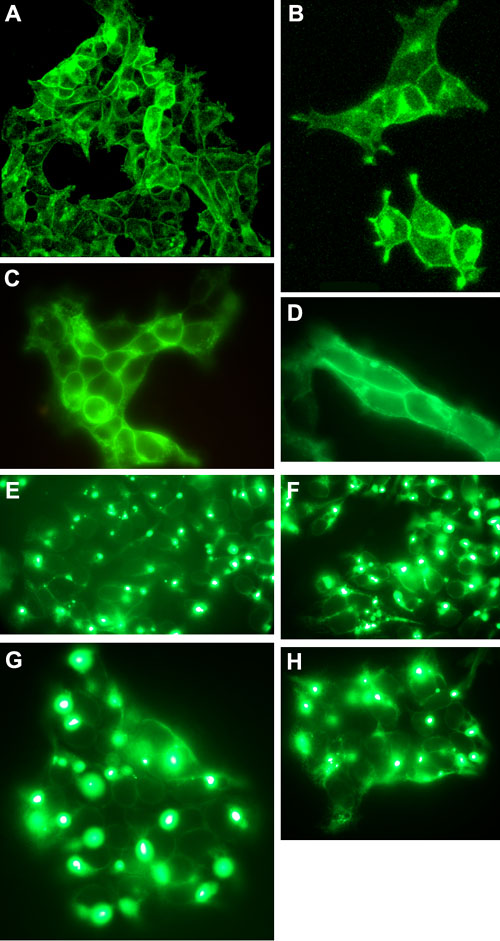
Figure 9. Protein expression in 293 cells 15 h after transfection
MP19greenTO (A, B, C, and D) or MP19To3greenTO (E, F, G, and H) cell lines were induced with tetracycline when the cells reached the correct cell density. 15 h following transfection, the cells were observed using confocal and Epi-fl microscopy. A: Confocal microscopy analysis of MP19green expression in 293 cells (EGFP filter set). The image was obtained using the inverted microscope with a 40x water objective. B: Conditions were identical with those in A, view of a different area of the coverslip. C: Epi-fl microscopy analysis of MP19green expression in 293 cells (EGFP filter set). The image was obtained using a Nikon Optiphot-2 upright microscope with the episcopic-fluorescence attachment EFD-3. Cells were observed using a 40x oil objective. D: Conditions were identical with those in C, except the image was taken with the 60x oil objective. E: Epi-fl microscopy analysis of MP19To3green expression in 293 cells (EGFP filter set). The image was obtained using a Nikon Optiphot-2 upright microscope with the episcopic-fluorescence attachment EFD-3. Cells were observed using a 40x oil objective. F: Conditions were identical with those in E, view of a different area of the coverslip. G: Epi-fl microscopy analysis of MP19To3green expression in 293 cells (EGFP filter set). The image was obtained using a Nikon Optiphot-2 upright microscope with the episcopic-fluorescence attachment EFD-3. Cells were observed using a 60x oil objective. H: Conditions were identical with those in E, view of a different area of the coverslip.