![]() Figure 21 of
Chen, Mol Vis 2002;
8:372-388.
Figure 21 of
Chen, Mol Vis 2002;
8:372-388.
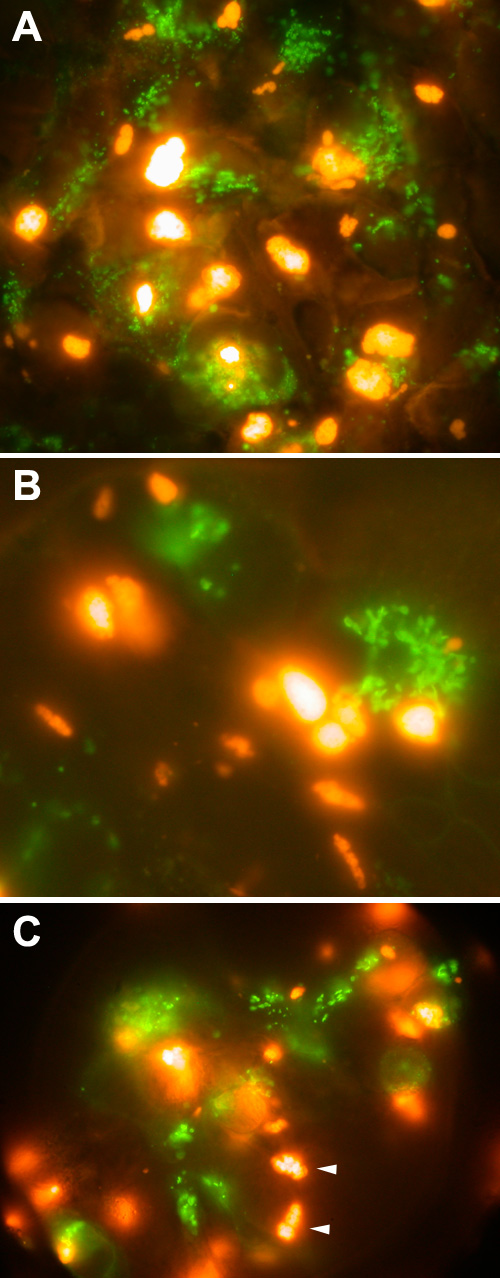
Figure 21. MP19To3red compared to Golgi-green protein expression in 293 cells
MP19To3redTO cells were cotransfected with the Golgi-pEGFP-N1 plasmid. 48 h following transfection with Golgi-pEGFP-N1, the cells were induced with tetracycline. The cells were observed with Epi-fl microscopy (EGFP and DsRed filter sets). A, B, and C are three separate images showing the expression of MP19To3red and Golgi-green protein. Note in C the typical large inclusion bodies (arrowheads). The images were obtained using a Nikon Optiphot-2 upright microscope with the episcopic-fluorescence attachment EFD-3, and a 40x oil objective. The cells observed in the images were photographed using a Nikon Coolpix 995 digital camera.