![]() Figure 16 of
Chen, Mol Vis 2002;
8:372-388.
Figure 16 of
Chen, Mol Vis 2002;
8:372-388.
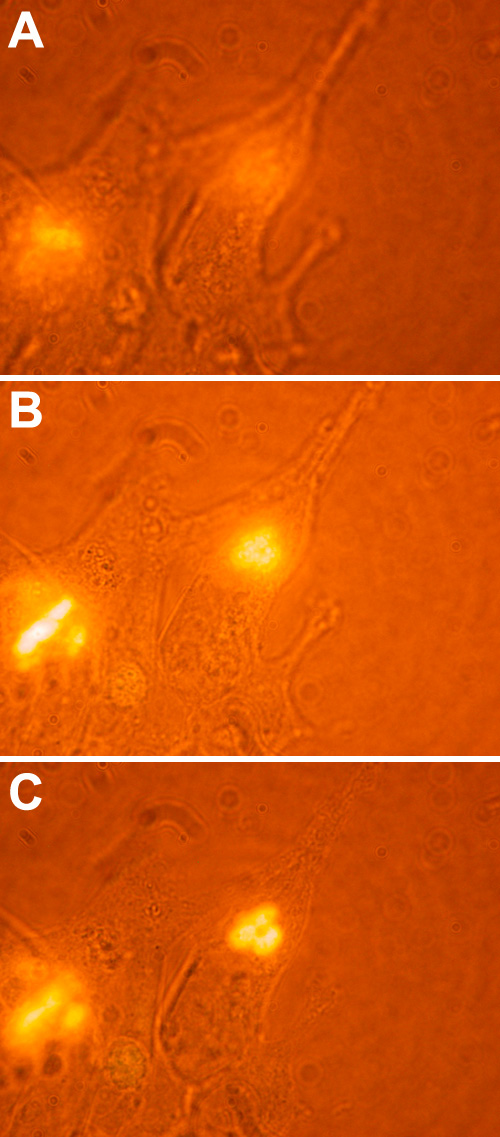
Figure 16. MP19To3red protein expression in 293 cells
MP19To3redTO cells were induced with tetracycline when the cells reached the correct cell density. About 7-10 days days following transfection, the cells were observed using Epi-fl microscopy (DsRed filter set). This is an Epi-fl image taken with the visible light lamp also turned on, revealing the overall cell shape as well as the red fluorescence of the MP19To3 protein. A through C were taken with the focus at the top of the cell (A) and then manually traversing through the cell in three total steps to finally focus on the MP19To3 protein (B through C). The images were obtained using a Nikon Optiphot-2 upright microscope with the episcopic-fluorescence attachment EFD-3. Cells were observed using a 60x oil objective. The cells observed in all of the images were photographed using a Nikon Coolpix 995 digital camera.