![]() Figure 13 of
Chen, Mol Vis 2002;
8:372-388.
Figure 13 of
Chen, Mol Vis 2002;
8:372-388.
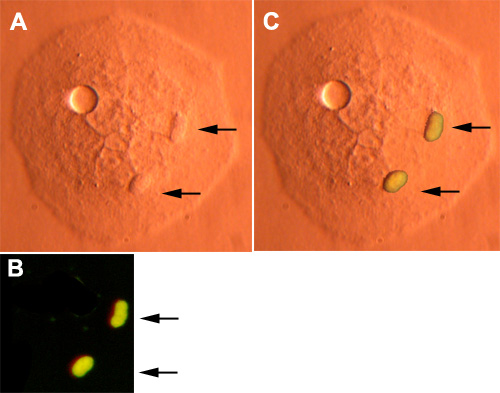
Figure 13. Expression of MP19To3green protein in a 293 cell
MP19To3greenTO, cells were induced with tetracycline when the cells reached the correct cell density. Six days following transfection, the cells were observed using confocal microscopy. A: A single cell visualized using the inverted microscope with Hoffman modulation contrast optics (40x water objective). Note the two rather large "bodies" within the cell (arrows). B: Confocal microscopy analysis of MP19To3green protein expression in the same single 293 cell (EGFP filter set). The image was obtained using the inverted microscope with a 40x water objective. Note that only two fluorescent inclusion bodies were observed in this image. C: Images from A and B were superimposed to demonstrate that the fluorescent bodies observed in B completely overlap the large bodies observed in A (arrows). The cell observed in A was photographed using a Nikon Coolpix 995 digital camera.