![]() Figure 2 of
Lampi, Mol Vis 2002;
8:359-366.
Figure 2 of
Lampi, Mol Vis 2002;
8:359-366.
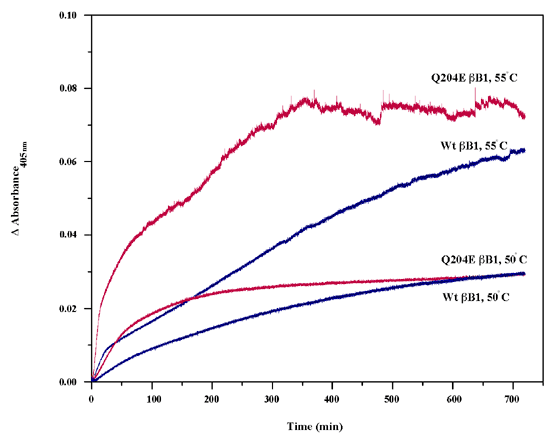
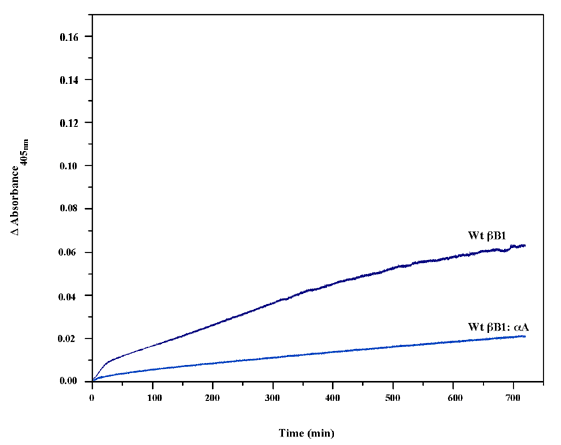
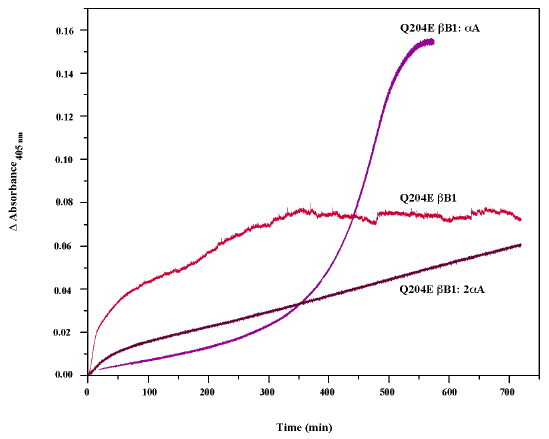
Figure 2. Thermal denaturation of wt and Q204E βB1 monomers
Thermal denaturation curves were obtained by heating proteins at 0.1 mg/ml in a 10 mM phosphate buffer, pH 6.8, and measuring light scattering at 405 nm. A: wt βB1 was heated at either 50 °C (lower blue curve) or 55 °C (upper blue curve). Q204E βB1 was also heated at either 50 °C (lower red curve) or 55°C (upper red curve). B: wt βB1 was heated at 55 °C with an equal molar amount of αA (light blue curve) and compared to heating wt βB1 alone (blue curve). C: Q204E βB1 was heated at 55 °C with equal molar amounts of αA (purple curve) or a 1:2 ratio to αA (dark purple curve) and compared to heating Q204E βB1 alone (red curve).
A:

B:

C:
