![]() Figure 1 of
Lampi, Mol Vis 2002;
8:359-366.
Figure 1 of
Lampi, Mol Vis 2002;
8:359-366.
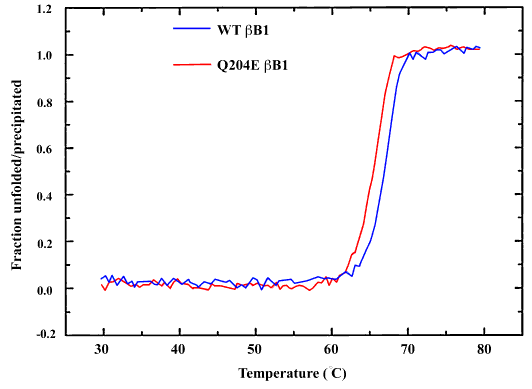
Figure 1. Percent of unfolded wt βB1 and Q204E βB1
Percent of unfolded wt βB1 (red curve) and Q204E βB1 (blue curve) were measured by changes in the CD spectra at 215 nm. Protein concentrations are 0.4 mg/ml in 10 mM phosphate buffer, pH 6.8. Cell path length is 1 mm.
