![]() Figure 4 of
Li, Mol Vis 2002;
8:341-350.
Figure 4 of
Li, Mol Vis 2002;
8:341-350.
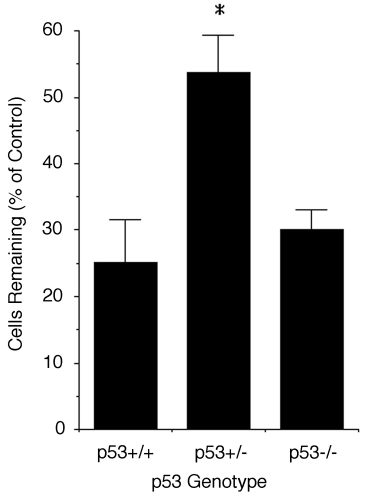
Figure 4. Quantification of NMDA-induced cell loss in p53 mutant mice
Quantitative cell loss in p53 wild-type and p53 mutant mice suggests distinct pathways of cell death. Bar graph showing quantitative analysis of cell counts in the ganglion cell layer of p53 mice 4 days after intravitreal injection of 160 nmol of NMDA. The data are represented as a percentage of cells in the control retinas that remain in the experimental eyes. The p53+/+ (an average of 74.8% cell loss, n=6) and p53-/- (an average of 70% cell loss, n=8) mice exhibit statistically equivalent amounts of cell loss (Mann-Whitney test, p>0.1). Previous studies using Thy-1 to identify retinal ganglion cells indicated that approximately 70% of the cells in this layer were ganglion cells (9, 26). Consequently, the amount of cell loss in these mice is probably indicative of nearly 100% ganglion cell death at this time point. Alternatively, p53+/- mice (an average of 46.3% cell loss, n=14) show significantly reduced cell loss (*p<0.02), relative to the other groups. The results suggest that a restricted p53-dependent pathway is active in heterozygous mice, but homozygous null animals utilize an alternative pathway.