![]() Figure 2 of
Bicknell, Mol Vis 2002;
8:333-340.
Figure 2 of
Bicknell, Mol Vis 2002;
8:333-340.
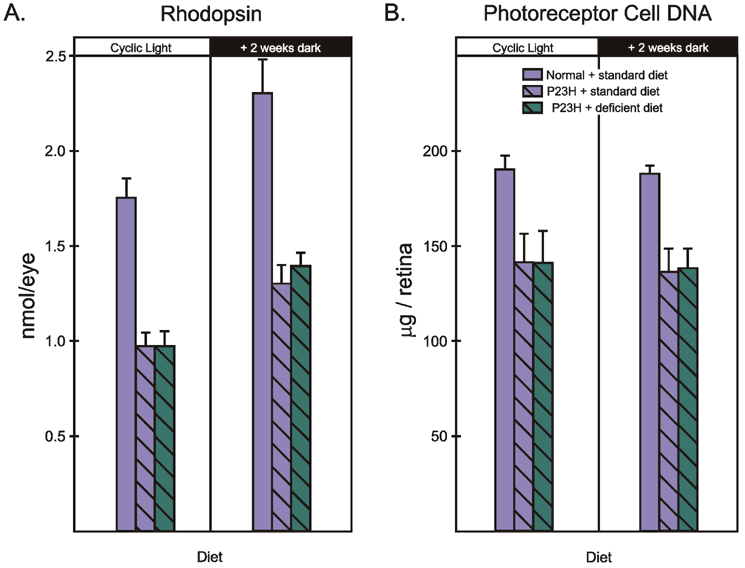
Figure 2. Influence of diet and light environment on rhodopsin and DNA levels
Rhodopsin (Panel A) and DNA (Panel B) levels in normal Sprague-Dawley and P23H transgenic rats. Values are expressed as the mean ± SD from 4-8 independent observations (N).
