![]() Figure 3 of
Stenkamp, Mol Vis 2002;
8:280-293.
Figure 3 of
Stenkamp, Mol Vis 2002;
8:280-293.
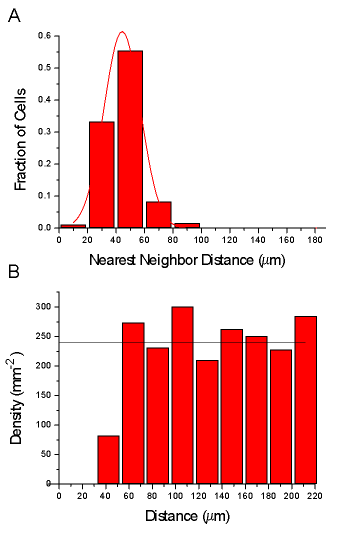
Figure 3. Pattern analysis of serotonin-positive cells in the inner retina of an adult zebrafish
Analysis of the pattern of serotonin-positive cells in the inner retina of an adult zebrafish, illustrating pattern characteristics that are common for inner retinal cells of various types. A, Nearest neighbor distance (NND) distribution, as a function of the fraction of cells within the analyzed sample. Note how the distribution is well estimated by a normal (Gaussian) function (red line), consistent with a non-random distribution of points. Conformity ratio analysis of the NND distribution [17] also reveals the two-dimensional pattern to be non-random. B, Density recovery profile (DRP) [60] analysis of the same pattern of serotonin-positive cells. Each serotonin-positive soma (abscissa value 0) is surrounded by a two-dimensional area that is devoid of other serotonin-positive somata (i.e., the density values equal zero below 30 μm). The density of the sample (black horizontal line) is not "recovered" until an annular area approximately 60 μm away from each soma is sampled. The recovered density thereafter approximates the density of the entire sample.
