![]() Figure 3 of
Mukhopadhyay, Mol Vis 2002;
8:271-279.
Figure 3 of
Mukhopadhyay, Mol Vis 2002;
8:271-279.
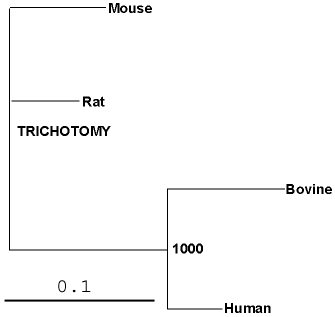
Figure 3. Phylogram of four different mammalian myocilin proteins
To assess the evolutionary interrelationship between the mammalian myocilins, a phylogenetic analysis was carried out. Since the level of sequence homology between these proteins is very high, a neighbor-joining tree was constructed using the entire sequence of the proteins. The scale denotes the branch length corresponding to substitutions per site. Trichotomy means that the tree is divided into three branches and the number 1000 denote the bootstrap value.
