![]() Figure 2 of
Wilson, Mol Vis 2002;
8:259-270.
Figure 2 of
Wilson, Mol Vis 2002;
8:259-270.
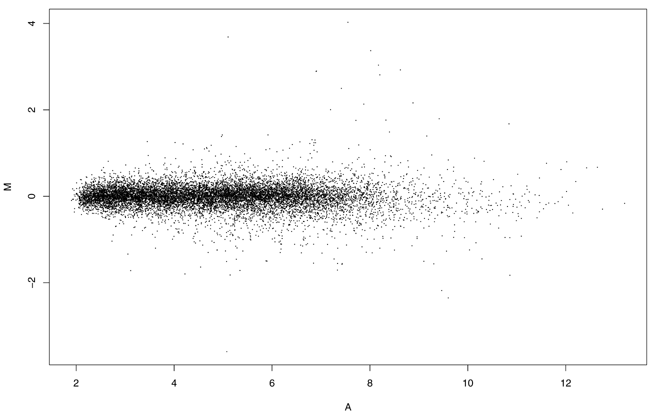
Figure 2. M versus A scatter plot
M vs A for microarray intensity data from treatment (T) and control (C) samples, where M is the log intensity ratio M=log2(T/C), and A is the mean log intensity. In this case average log2(PM) for each probe set was used as the measure of expression for each gene. Other summary measures of expression would show similar behavior.
